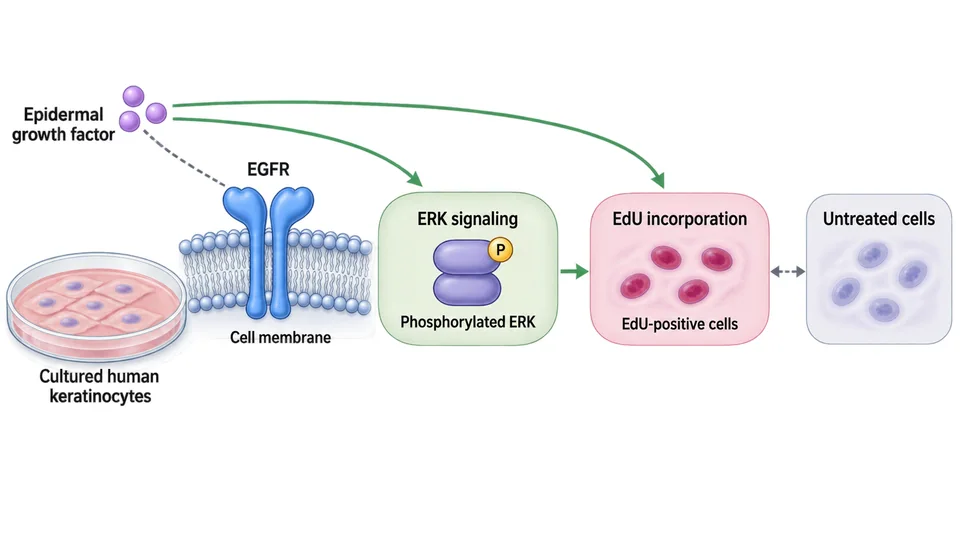
A visual summary of a research paper
Unlike a decorative cover image, a graphical abstract organizes evidence into a readable visual argument. The image should make the central relationship or sequence understandable without replacing the paper, caption, or author review.
What a graphical abstract is for
Readers scan journals, databases, presentations, and social posts quickly. A graphical abstract gives them a structured entry point: what was studied, what happened, and why the result matters.
Its job is orientation, not compression at any cost. A strong visual reduces the research story to its most useful path while keeping qualifications and uncertainty intact.
The essential parts
Most effective graphical abstracts contain a small set of accountable elements: a defined subject or input, a method or mechanism, an observed result, and a short takeaway. Arrows and grouping should reveal how those parts relate.
The exact composition can be a workflow, mechanism, comparison, or central summary. Choose the structure that matches the logic of the paper rather than forcing every study into the same template.
How it differs from other figures
A data figure proves or documents a specific result. An illustration may explain one mechanism. A graphical abstract connects selected parts of the whole paper into a single overview.
It also differs from a written abstract: the visual depends on hierarchy, proximity, direction, and consistent symbols. Text should support the visual sequence, not reproduce paragraphs from the manuscript.
Four questions the visual should answer
Use these questions to decide what belongs in the image and what should remain in the manuscript.
Establish the system, population, condition, or problem in one clear starting zone.
Show only the method needed to interpret the result; avoid turning the image into a protocol.
Give the principal measured finding the strongest visual emphasis.
State the supported implication without extending beyond the study's evidence.
Does the image work as a graphical abstract?
A useful draft should pass all six checks before journal-specific formatting begins.