EGF–EGFR signaling drives keratinocyte proliferation
Keratinocytes connect membrane EGFR activation with ERK phosphorylation and increased EdU incorporation.
Use biology presetA biology graphical abstract needs to connect scales without inventing certainty. Explore each biology graphical abstract as a structural reference for cells, organisms, pathways, microbiomes, and measured outcomes.
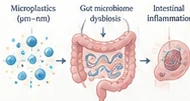
Keep each scale distinct and every arrow accountable.
Each biology graphical abstract below emphasizes a different task: explaining a pathway, comparing conditions, summarizing an intervention, or tracing a response. The biology graphical abstract copy and artwork are concept examples, not claims from published studies.
Keratinocytes connect membrane EGFR activation with ERK phosphorylation and increased EdU incorporation.
Use biology presetButyrate-treated organoids show more ZO-1 and lower FITC-dextran permeability than vehicle controls.
Use biology presetFolate decoration increases nanoparticle uptake and lowers target mRNA in receptor-positive tumor cells.
Use biology presetHypoxia stabilizes HIF-1α, promotes VEGFA promoter binding, and raises VEGFA mRNA in endothelial cells.
Use biology presetMatched blood samples and single-cell RNA sequencing reveal an expanded interferon-high monocyte population.
Use biology presetTreated colorectal tumor organoids show lower phosphorylated ERK and smaller organoid area than controls.
Use biology presetProximity ligation links greater PD-1–SHP2 association with a lower T-cell calcium response.
Use biology presetLPS-exposed macrophages secrete more TNF-α and IL-6 than vehicle-treated cells after six hours.
Use biology presetA rough biology graphical abstract often mixes background, methods, and conclusions on one plane. Revision should establish scale, reading order, and evidence type. The final biology graphical abstract remains a draft until subject experts verify every structure and causal relationship.

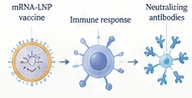
A useful biology graphical abstract prompt identifies the system, intervention, evidence, and supported conclusion. Start with one of these tasks, then replace every generic term with information from your study.
Choose the biological scale, define the measured response, and keep interpretation tied to evidence.
Open the biology preset